Track treatment effectiveness
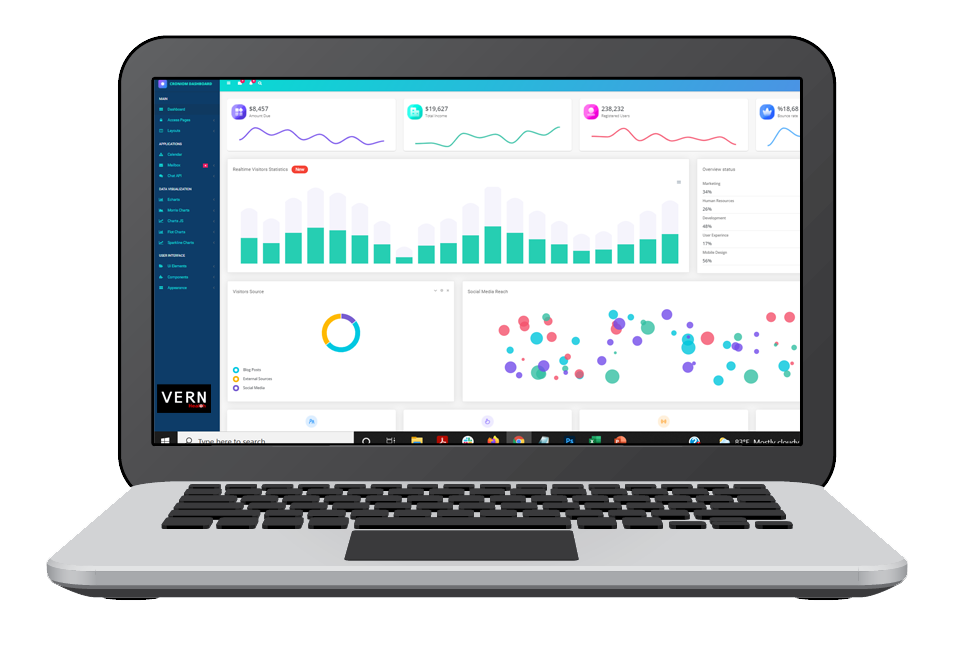
VERN Health provides a revolution in emotion tracking-by implementing a user friendly dashboard that tracks each interaction you have with a patient, and stores their emotional states over each contact. You can see how patients respond to treatment, whether there are new problems and issues arising, and spot trends before they become problems.
All of this is presented in an easy-to-use dashboard. Simply select the patient you want to see, and a dashboard opens to provide you with relevant data about the person’s condition over time.
Here are some frequently asked questions about this feature:
VERN Health provides emotional and mental health data on the patient. While the exact data depends on the toolkit and the apps you have +Enhanced, in general the information will be presented in charts and on a linear temporal graph. If you have +Enhanced VERN Health the additional information for each partner app will be provided on the dashboard. For example, if you have added a blood analysis from Confluence Diagnostics, the results from that will be present on the dashboard in its own separate area.
VERN Health allows you to generate summary reports depending on the particular criteria. We can provide you with the individual, group, or the entire practice’s emotive disposition over time.
VERN Health believes that the data provided will not only help, but will be instrumental in clinical trials. This offers a way to get the affective (and qualitative) data necessary based on self-reporting (visits) and surveys and forms (pre and post visit). VERN Health provides a compelling way to track the effectiveness of treatment.


